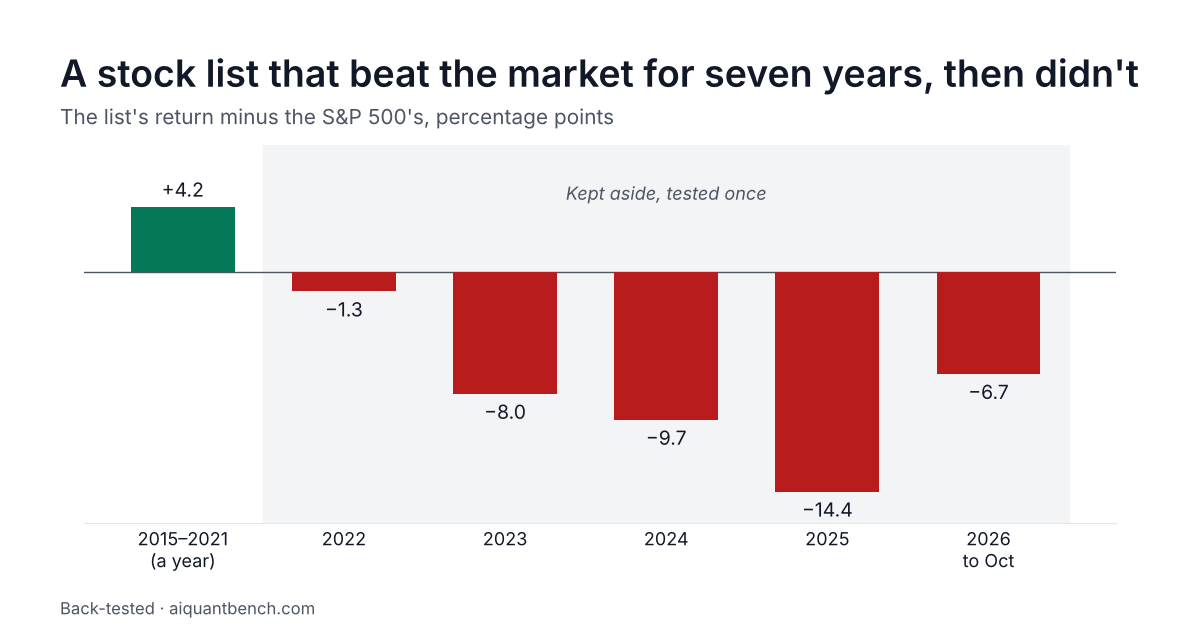
A list of the most profitable US companies beat the S&P 500 by 4 points a year for seven years. Then it trailed by 8 a year.
Didn't work · 19 Oct 2026 · 3 min read
Short answer: The 50 large US companies with the most gross profit for their assets made 19.6% a year in 2015–2021 against 15.3%. On 2022–Oct 2026, kept aside, 3.8% against 11.8%.
A simple idea with good credentials
One of the best-known ideas in investing research is that profitable companies do better. A popular way to measure it is gross profit divided by total assets: how much a company makes from its sales, before overheads, for every dollar of assets it uses.
So I built the simplest version I could. Every March, take the 50 large US companies with the highest score, hold them in equal amounts for a year, then review the list.
For seven years it beat the market comfortably. Then I ran it on the years I had kept aside, and it fell far behind in every one of them.
The result
| 2015–2021: a year | 2022 | 2023 | 2024 | 2025 | 2026 to Oct | 2022 – Oct 2026: a year | |
|---|---|---|---|---|---|---|---|
| The list | 19.57% | −20.0% | 18.2% | 15.2% | 3.3% | 6.1% | 3.77% |
| S&P 500 | 15.33% | −18.7% | 26.2% | 24.9% | 17.7% | 12.8% | 11.76% |
("A year" is the average yearly growth, compounded.)
For seven years the list led by more than 4 points a year. Then, on the years it had never seen, it trailed by about 8 points a year. It lagged in every year from 2023, and it didn't even protect in the 2022 fall: it lost slightly more than the market.
Why it looked so good before
Looking at what an earlier version of the list actually held explained a lot:
- About half of its lead came from what it left out. Banks and insurers don't report a gross-profit figure, so they can never make the list. In years when financial companies lagged, simply not owning them looked like skill.
- It was really a handful of companies. That version had 67% of its money in ten names. The biggest by far was Amazon, at one point 28.6% of the whole list, and its two best years were Amazon's best years.
So the seven-year lead rested less on "profitable companies win" and more on a few big winners and one missing sector.
The hindsight trap
Here's another way a list like this fools you. Today's list, checked against 2025, averaged +25.5%, well ahead of the S&P 500's +17.7%. But today's list was chosen knowing which companies are doing well now. The list you would actually have held during 2025 made +3.3%.
Why it fell behind (my best guess)
I didn't test this, but from 2023 to 2025 the market was led by a small number of giant tech companies. An equal-amount list of 50, leaning toward shops and consumer brands, owned too little of them.
How I tested it
Skip this if you trust me.
- The figures: gross profit and total assets from the companies' official SEC filings, each used only after it was published.
- The list: the 50 highest-scoring large US companies, equal amounts, reviewed each March. The chosen version allowed at most 12 companies from any one sector. A basic version without that limit did a little worse in both periods (18.20% a year, then 3.18%).
- Choosing and the exam: I picked the version on February 2015 to December 2021 and froze it. January 2022 to October 2026 stayed untouched until one final run.
- Luck: with no real edge, a lead that size over seven years would turn up by chance about 1 time in 30. But it was the best of several versions I tried, which makes luck more likely.
The catch
Seven years is short. A real advantage of a couple of points a year would need decades of data to prove, so a test like this can only rule out big effects. The unseen years are short too, and they were an unusual stretch for the market.
What I took from it
A clean, well-researched idea can beat the market for years and then stop. Before trusting a winner, look at what it actually holds, and never judge a stock list by how today's version did in the past.
Have you held a strategy that worked for years and then stopped? What did you do?