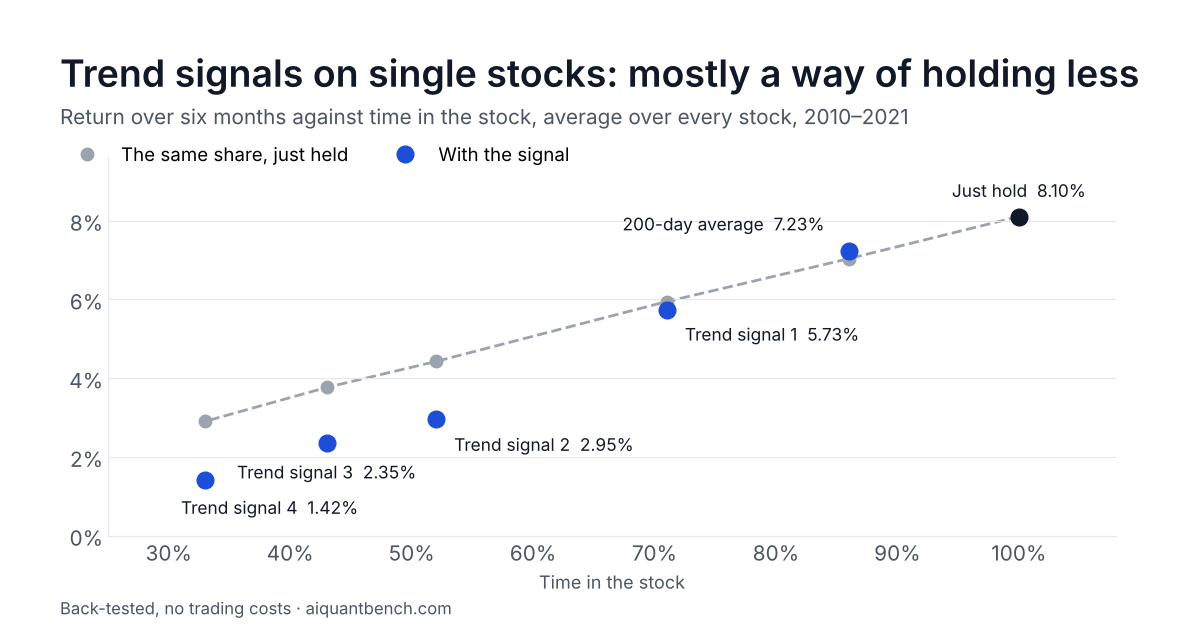
Five trend signals on single stocks, 2010–2021. Each cut losses only by staying out, and holding a smaller share did as well or better.
Didn't work · 24 Oct 2026 · 4 min read
Short answer: Every signal cut losses only by being out of the stock more of the time. Holding the same smaller share all the time made as much or more, with a similar or smaller worst fall.
The promise
Trend signals promise the best of both worlds: stay in a stock while it rises, and step aside before the big falls. Sell when the price drops below its 200-day average, or follow some other trend rule.
I tested five such signals on individual US stocks, 2010–2021. Every one of them did cut the losses. But each did it the same boring way: by keeping you out of the stock more of the time. And simply holding a smaller amount all the time did as well or better.
The fair comparison
Here's the trap. A signal that keeps you in a stock a third of the time will, of course, have smaller falls than holding it all the time. So would putting a third of your money in the stock and leaving the rest in cash.
So for each signal I asked: did it beat holding the same share of money in the stock, all the time? If it can't beat that, it isn't choosing good moments, it's just holding less.
The result
Average over every stock on the lists, for every six-month stretch from 2010 to 2021:
| Rule | Return | Time in the stock | Same share, just held | Worst fall | Same share's worst fall | Trades a year |
|---|---|---|---|---|---|---|
| Just hold | +8.10% | 100% | −23.4% | 4.0 | ||
| 200-day average | +7.23% | 86% | +7.03% | −20.4% | −20.4% | 8.3 |
| Trend signal 1 | +5.73% | 71% | +5.94% | −18.4% | −17.3% | 8.5 |
| Trend signal 2 | +2.95% | 52% | +4.42% | −15.4% | −12.9% | 15.7 |
| Trend signal 3 | +2.35% | 43% | +3.76% | −13.2% | −10.9% | 24.9 |
| Trend signal 4 | +1.42% | 33% | +2.90% | −12.1% | −8.3% | 20.5 |
("Return" is over six months. "Worst fall" is the average biggest drop from a peak within the six months.)
The less of the time a signal held the stock, the smaller its falls. But holding the same smaller share made more money than four of the five signals, with an even smaller fall.
The one exception is the 200-day average: +7.23% against +7.03% for the same share held. That's a tie. When I shifted the signals' dates at random, the "edge" over holding the same share came out as high as +1.39 points by luck alone.
Rising and falling markets
It helps to look at the market's direction. In six-month stretches when the S&P 500 rose, trend signal 4 (in the stock a third of the time) made +2.3% while holding made +11.7%. When the S&P 500 fell, it lost 3.1% while holding lost 10.2%.
Both are roughly what you'd expect from being in the stock a third of the time. The signal didn't dodge the bad stretches more than the good ones. It just sat out a lot of both.
What about later years?
I kept 2022 to October 2026 aside. On those years, holding a portfolio of the same kind of stock lists made 7.4% a year. Selling each stock when it fell below its 200-day average made 4.5% a year. The S&P 500 made 11.9%.
On 2010–2021 the same 200-day exit had come close (18.2% a year against 18.8% for holding the lists). On the unseen years it cost about 3 points a year.
How I tested it
Skip this if you trust me.
- The stocks: monthly lists of large US stocks from an earlier scoring method of mine. The lists weren't special: they failed their own test later, trailing the S&P 500 on the years kept aside.
- The test: for every stock on the lists and every six-month stretch from 2010 to 2021, I followed each signal day by day, and compared it with holding the stock and with holding the same share of money in it all the time.
- The signals: the 200-day average, plus four other trend signals that I'm not describing here.
- Luck check: I reran each signal with its dates shifted at random, to see how big an edge luck alone produces.
The catch
- No trading costs in the main table. Some signals traded 20 to 25 times a year, so costs would make them look worse.
- The six-month stretches overlap heavily. Twelve years of data is really about twelve independent results, not thousands.
- These are the years I used for research. The later-years check is separate, and it pointed the same way.
What I took from it
On single stocks, a trend signal is mostly a complicated way of holding less. If what you want is smaller falls, holding a smaller share is simpler, cheaper, and did as well or better.
Do you use a trend signal on individual stocks? Have you ever compared it with simply holding less?