I tested 22 ways to time the S&P 500 from 1994. Waiting for a dip lost every time.
Didn't work · 18 Oct 2026 · 3 min read
Short answer: Every wait-for-a-dip rule made less than buying and holding, and the deeper the dip, the worse. Stepping aside in downtrends cut the worst falls, but its small lead came from two crashes.
Two pieces of advice everyone has heard
- "Don't buy now, it's too high. Wait for a dip."
- "Get out when the market turns down, and back in when it recovers."
Both sound like common sense. I tested 22 versions of them on 28 years of S&P 500 history, 1994 to 2021, and then on the years since.
The short version: waiting for a dip lost to simply holding every single time. Stepping aside in downtrends did make the falls smaller, but it didn't reliably make more money.
The monthly saver
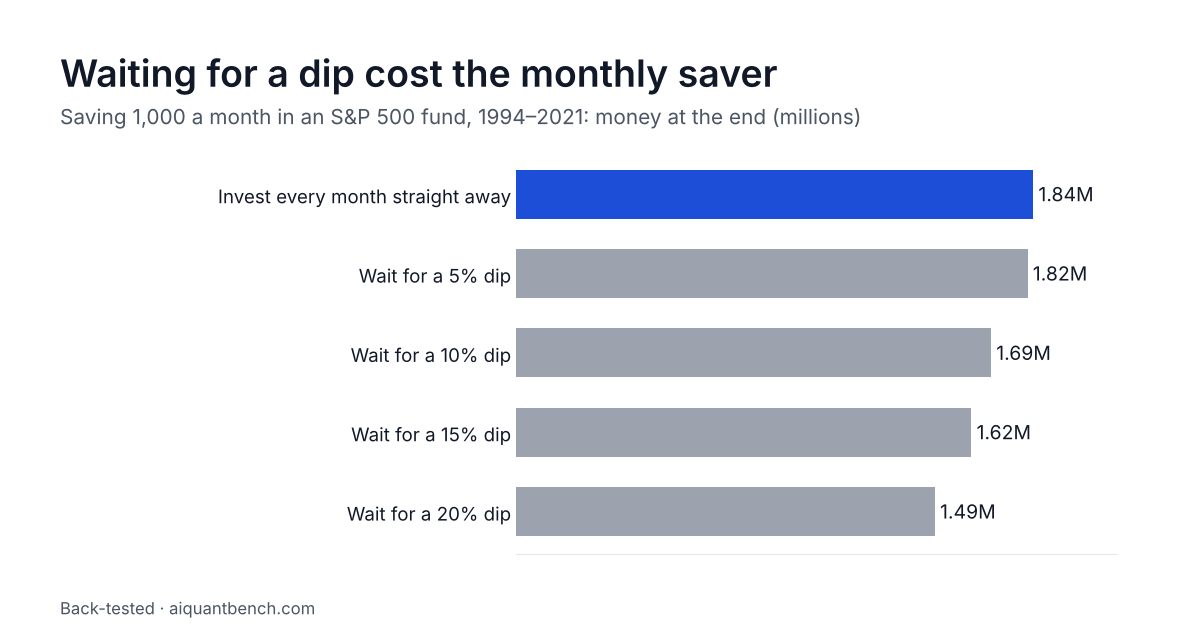
Most people put money in every month. So I followed someone saving 1,000 a month over those 28 years, 335,000 in total. Investing straight away each month ended with 1.84 million. Holding the cash until the market dipped did worse, and the more patient the saver, the worse it got: waiting for a 5% dip ended with 1.82 million, 10% with 1.69 million, 15% with 1.62 million, and 20% with 1.49 million. That patience cost about 350,000.
All the main rules, 1994–2021
| What you do with 100,000 | Return a year | Became about | Worst drop |
|---|---|---|---|
| Just buy and hold | 10.6% | 1.7 million | −55% |
| Buy after a 5% dip, hold 6 months | 10.3% | 1.6 million | |
| Buy after a 10% dip, hold a year | 6.2% | 540,000 | |
| Buy after a 20% dip, hold a year | 3.5% | 260,000 | |
| Buy below the 200-day average, hold a year | 7.5% | 760,000 | |
| Stay in only above the 200-day average, checked daily | 8.3% | 930,000 | −24% |
| Stay in only above the 200-day average, checked monthly | 11.0% | 1.9 million | −22% |
("Return a year" is the average yearly growth, compounded.)
Waiting for a dip made less in every version, and its worst drops (−47% to −58%) were no better than holding. The market rises most of the time, and while you wait, your money sits in cash. Waiting for 20% dips left it invested only 18% of the time.
Stepping aside in downtrends looks better: the monthly version made about the same as holding, with a worst drop of 22% instead of 55%.
Why the trend rule isn't the answer either
- All of its advantage came from 2000–2009, a decade with two deep bear markets. In those years it made about 7.8% a year while holding lost about 1.0% a year.
- It fell behind the rest of the time, by about 5 points a year in 1994–1999 and again in 2010–2021. In 2010–2021 the daily version made 10.0% a year against 15.5%: falls recovered fast, so it kept selling just before the rebound.
- Try 22 rules and one will look good by chance. This one's lead was too small to rule that out.
And since then? From 2022 to October 2026 the trend rule made 7.3% a year against 11.9% for holding. In the 2022 fall it lost 17.4%, almost as much as holding (18.2%). The same choppy fall was far worse for a fund that moves three times as much as the index; that story is in the article on 3x funds.
How I tested it
Skip this if you trust me. I used SPY, the oldest S&P 500 fund, with dividends. The dip rules waited for a fall of 5%, 10%, 15% or 20% from the recent high (or a close below the 200-day average), then held for six months or a year before going back to cash. Money waiting on the sidelines earned the Treasury bill rate, and every trade cost 0.05%.
The catch
This is the US market, which rose strongly over most of these years. A trend rule shines only in long, steady falls. There were two of those from 1994 to 2021 and none since, so another period could look different.
What I took from it
Time in the market beat timing the market in every version I tried. Waiting for a dip was the most expensive habit of all.
Do you wait for dips before you buy? What would it take to change your mind?