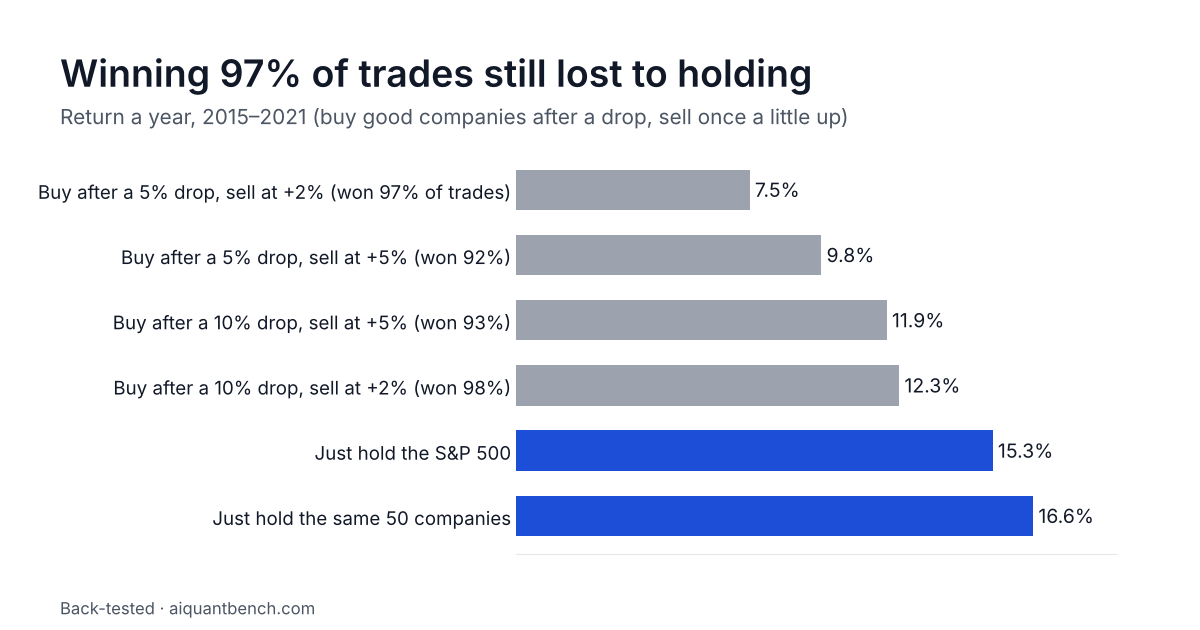
A method that won 97% of its trades made 7.5% a year. Holding the same stocks made 16.6%.
Didn't work · 19 Oct 2026 · 4 min read
Short answer: Buying good companies after a drop and selling each once a little up won 92–98% of trades in 2015–2021, but made 7.5–12.3% a year. Holding the same companies made 16.6%.
The method that almost never loses
Here's a way of trading that feels wonderfully safe:
- Only buy good, profitable companies.
- Buy them after a drop, so you pay less.
- Sell as soon as you're a little up, say 2%, and bank it.
- Never sell at a loss. A good company will come back.
Almost every trade ends in profit. It feels like you can't lose, and lots of people trade exactly like this.
I tested it on large, very profitable US companies from 2015 to 2021. It won up to 98% of its trades. It still made far less than simply buying the same companies and holding them.
The clearest example is Nvidia. Replaying the same selling habit on it for the three years to October 2026, the back-test bought and sold it 17 times and won 16 of them. Total: +30.8%. Simply holding the stock over the same three years made about +407%.
The result, 2015–2021
| Version | Trades that made a profit | Return a year | 100,000 became about |
|---|---|---|---|
| Buy after a 5% drop, sell at +2% | 97% of 682 | 7.5% | 165,000 |
| Buy after a 5% drop, sell at +5% | 92% of 340 | 9.8% | 191,000 |
| Buy after a 10% drop, sell at +2% | 98% of 659 | 12.3% | 223,000 |
| Buy after a 10% drop, sell at +5% | 93% of 343 | 11.9% | 217,000 |
| Just hold the same 50 companies | 16.6% | 289,000 | |
| Just hold the S&P 500 | 15.3% | 267,000 |
("Return a year" is the average yearly growth, compounded.)
Even the best version made about 4 points a year less than holding. And the timing added nothing: buying after a 5% drop did worse than buying the same companies on random days, and after a 10% drop, about the same.
How can you win 97% of the time and still lose?
The wins are small. Every winner stops at +2% or +5%. On average a trade made only 1% to 3%.
The losses are big. In the first version, 22 of the 682 trades never came back and were sold after a year, about 36% down on average. One of those wiped out the profit of roughly 35 winners. The worst were companies that looked solid until they broke, like Kohl's (−72%), Macy's (−56%) and Capri (−54%).
Money sat idle. Waiting for drops left 14% to 34% of the money in cash, in years when the market rose strongly.
Drops often kept going. A stock that had just fallen 5% kept falling more often than it bounced back.
How I tested it
Skip this if you trust me.
- Companies: each month, the 50 large US companies with the most gross profit for the assets they use, from their official filings, using only filings already published at the time. I left out health insurers, whose accounts make them look far more profitable on this measure than they are.
- Buying: when one closed 5% (or 10%) below its high of the last 20 trading days, buy at the next day's open. Up to 10 positions, equal amounts.
- Selling: at 2% (or 5%) above the price paid. No stop-loss; a stock that never got there was sold after a year.
- The rest: idle cash earned the Treasury bill rate, and every trade cost 0.05%.
- Nvidia and Apple: for 2023–2026 I replayed the selling habit on two stocks, buying at levels from a chart tool of mine. As a check, I ran the same selling rule with buys on random days. On Nvidia, random buys made +48.9%, more than the tool's. On Apple, all 9 trades won, for +20.6%, about the same as random buys (+19.2%).
The catch
2015–2021 were strong years, which favour holding. Some companies that later failed are missing from free price data, which if anything flatters the method. And the recent replay covers only two stocks that rose a lot. It shows what a small profit target gives up in a strong rise, but it isn't a full test.
I didn't run the method itself after 2021, but the list of profitable companies behind it stopped beating the market too. That story is in a stock list that beat the market for seven years, then didn't.
What I took from it
Judge a method by how much it makes compared with simply holding the same things, never by how often it wins. A very high win rate usually means the profits are capped and the losses aren't, and a few big losses decide the result.
Do you trade like this? What's your profit target, and have you ever compared your results with just holding?